

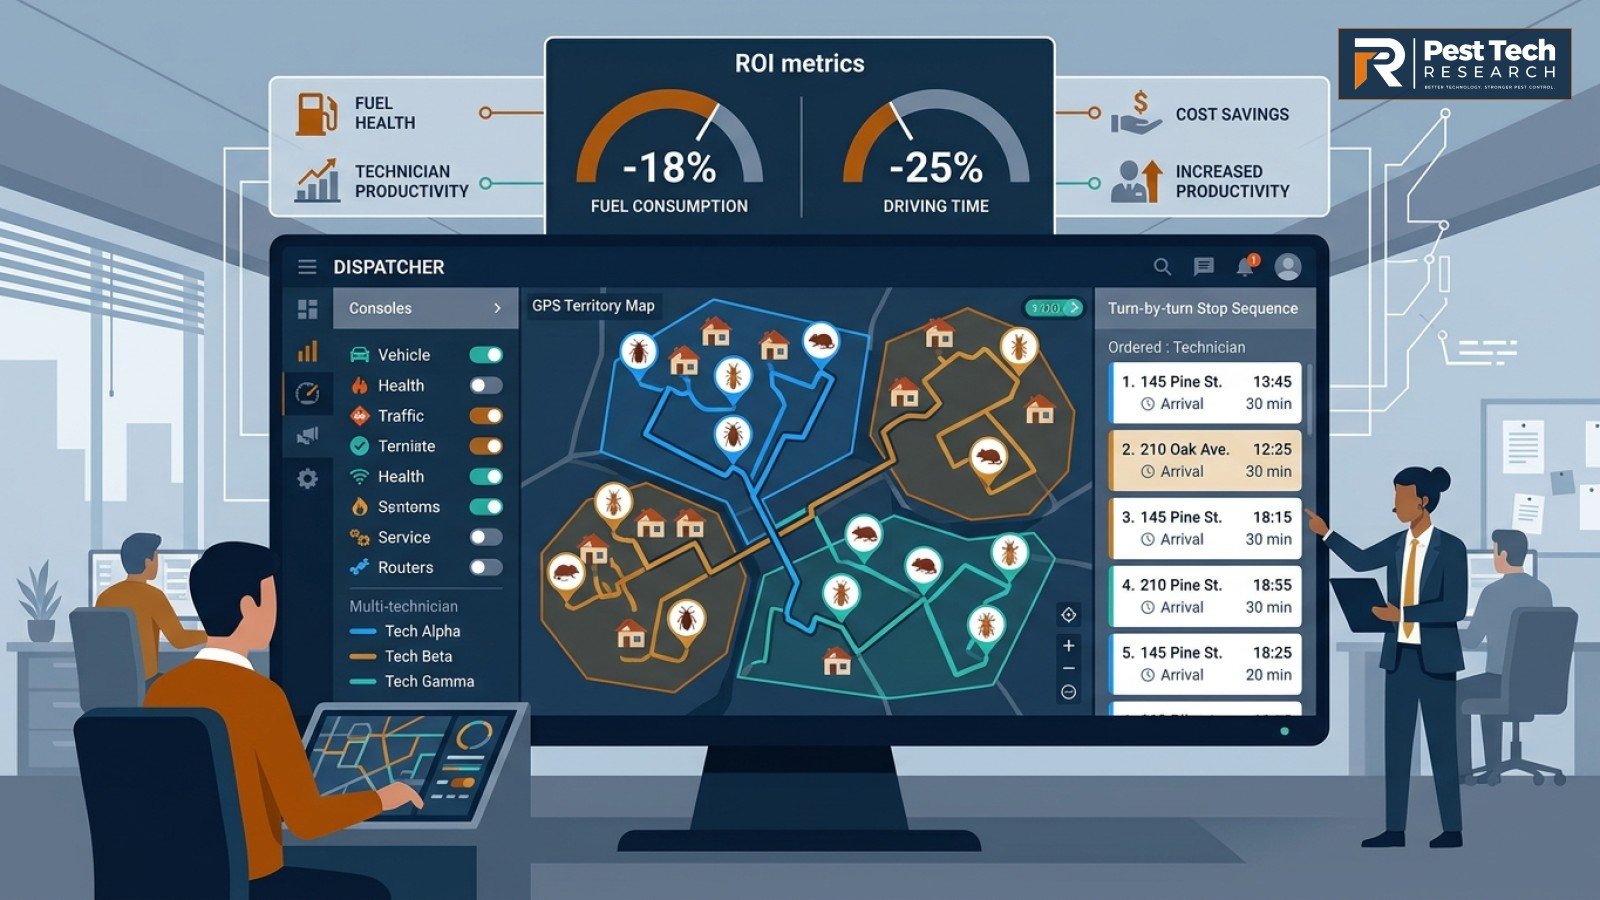
True route optimization software in pest control is fundamentally different from turn-by-turn navigation (like Google Maps or Waze). Optimization algorithms analyze multi-stop sequence efficiency, recurring territory clustering, technician chemical licensing constraints, and appointment arrival windows across an entire fleet. In practical field operations, deploying algorithmic route density reduces technician windshield time by 18% to 26%, saving $4,200–$7,800 annually per truck in fuel and labor while unlocking capacity for 1 to 2 additional billable stops per technician per day.
- Windshield Time is Pure Overhead: A technician driving 90 minutes per day costs your business $60–$80 in non-billable payroll, vehicle depreciation, and fuel every single shift.
- Navigation vs Optimization: Navigation calculates the fastest path between Point A and Point B; optimization determines whether Point B should be visited today or next Thursday alongside 8 neighboring homes.
- Territory Clustering First: Algorithmic reordering within an inefficient schedule cannot fix a poorly clustered geographic territory.
- The Service Window Trade-Off: Promising customers strict 1-hour appointment windows reduces route efficiency by up to 30% compared to 2-hour or “anytime exterior” scheduling windows.
The Economics of the Windshield in Pest Operations
In a residential pest control business, your field technicians are your sole revenue-generating assets. Yet, in many operations without modern routing software, technicians spend 2.5 to 3.5 hours of an 8-hour shift driving between scattered stops.
If a technician completes 8 stops per day with an average ticket of $85, each billable hour is worth approximately $170 in company gross revenue. Every 30 minutes of wasted driving is not just an $18 labor expense—it represents an uncaptured recurring service stop.
Simple Navigation vs. Algorithmic Route Optimization
Many operators believe they have “route optimization” because their mobile app has a button that opens Google Maps. This is a misunderstanding:
| Feature Dimension | Simple Map Navigation (Google / Waze) | Pest Route Optimization Engine (FieldRoutes/OptimoRoute) |
|---|---|---|
| Sequence Determination | Manual dispatcher order; navigates in static sequence. | Algorithmic sequence calculated to minimize total fleet transit miles. |
| Territory Clustering | None. Treats each destination independently. | Clusters stops into tight geographic zones (e.g., North Subdivisions on Day 1). |
| Licensing Constraints | None. Cannot account for technician skills. | Matches termite WDO stops only to licensed termite certified technicians. |
| Truck Equipment Capacity | None. | Accounts for power rig water tank capacity, ladder availability, or rodent bait inventory. |
| Same-Day Job Insertion | Requires dispatcher manual calculation. | Calculates lowest-marginal-distance insertion point for emergency calls. |
The 4 Pillars of High-Density Pest Routing
1. Geographic Zone Clustering
The highest route density is achieved before daily routing even begins: during the sales and recurring scheduling stage. By dividing your market into geographic quadrants (e.g., Zone A = Mondays, Zone B = Tuesdays), technicians spend the majority of their day treating homes separated by minutes rather than miles.
2. The “Exterior-Only” Scheduling Advantage
Residential quarterly pest programs generally focus on the exterior perimeter barrier, weep screeds, eaves, and bait stations. When operators transition customers from required indoor appointments to convenient exterior-only service (with free indoor retreatments upon request), route constraints drop dramatically. Technicians can treat 12 to 16 exterior stops per day with minimal scheduling friction.
3. Same-Day Emergency Insertion Rules
When an urgent wasp or rodent call arrives at 11:00 AM, a route optimization engine evaluates all active fleet positions via GPS and calculates which technician can absorb the stop with the lowest marginal detour miles and without violating existing customer appointment windows.
4. Traffic-Adjusted Sequence Smoothing
Modern routing algorithms pull live and historical municipal traffic data. In urban metro areas (such as Atlanta, Houston, or Los Angeles), reversing a 10-stop route sequence to avoid rush-hour highway choke points saves 35 to 50 minutes of idle vehicle idling per day.
Real-World Operational ROI (Our Calculation)
• Average miles driven per truck per day (unoptimized): 85 miles.
• Optimized route miles per day (22% reduction): 66.3 miles (18.7 miles saved/day/truck).
• Annual vehicle expense saved ($0.65/mile federal operating rate × 18.7 mi × 250 days): $3,038 / truck / year.
• Capacity unlocked: 1.2 additional billable stops per technician per day × $85 average ticket = $25,500 in new annual gross margin per technician.
• Total Fleet Net Impact (5 Trucks): Over $142,000 / year in combined fuel savings and additional recurring capacity.
Frequently Asked Questions
Which pest control software has the best built-in routing engine?
In our Commercial Pest Software Directory, platforms such as FieldRoutes and PestPac offer robust native routing engines. For smaller fleets using platforms with basic routing, standalone routing APIs (such as OptimoRoute or Routific) can be integrated via webhooks.
- Pest Tech Research Fleet Telematics & Route Density Benchmark Study (2025/2026).
- U.S. Internal Revenue Service (IRS): Standard Mileage Business Operating Cost Benchmarks.
- OptimoRoute and FieldRoutes Technical Dispatch Engine Architecture Documentation.